Market Opportunities in Focus
BY Janne Muta
|April 16, 2024DAX
The European Central Bank (ECB) has maintained interest rates at a peak of 4.5%, underlining a cautious approach towards inflation, which continues to moderate towards the ECB's target of 2%. This decision signals a stabilisation in monetary policy, which may reassure investors wary of excessive tightening.
Consumer confidence, although still negative at -14.9 in March, has improved slightly. This uptick suggests a gradual recovery in consumer sentiment, which could bolster retail and consumer goods sectors on the DAX. The PMI data indicates a mixed economic landscape. While the manufacturing sector remains under pressure with a PMI of 46.1, indicating contraction, services have rebounded to 51.5, pointing towards a sectoral shift that could favour service-oriented businesses over traditional manufacturing.
Employment data, showing a slight quarterly increase, alongside a stabilising inflation rate, provides a buffer against economic slowdown. However, the continued contraction in retail sales by 0.5% in February underscores lingering consumer caution, potentially dampening prospects for consumption-driven stocks.
The current market focus however seems to be on the potential wider conflict in the Middle East. As Israel could well strike back at Iran, we could see further downside volatility in DAX and the other equity indices.
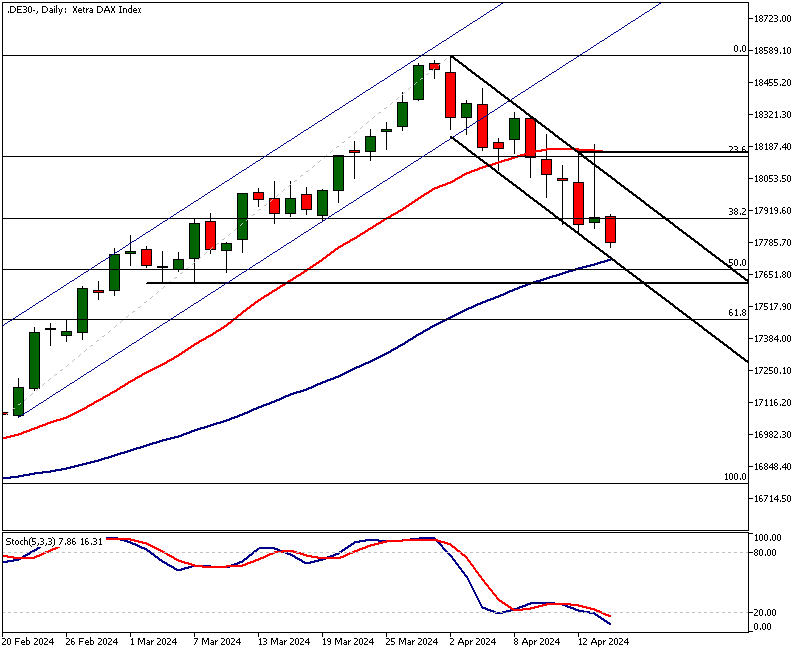
DAX has been retracing with the rest of the main equity indices while VIX, the so-called Wall St. fear index rallies strongly. The index rallied strongly intraday on Monday but the move was thwarted by sellers that appeared near the 23.6% Fibonacci retracement level creating a technical confluence area around yesterday’s high. The SMA(20) is closely aligned with the level also. The nearest confluence area below the current market price at 17,622 and 17,713 is formed by a minor daily support level (17,622), the 50% Fibonacci retracement level and the SMA(50). The market has been moving lower after it broke out of the bullish trend channel, which suggests that this confluence (below the market) area could be tested and possibly penetrated. This could mean the 17,462 level (61.8% Fibonacci level) gets tested. Alternatively, if DAX attracts institutional buying inside the 17,622 - 17,713 zone we could see the market rallying to the 23.6% Fibonacci retracement level again.
USDCAD
The recent economic data from the US and Canada highlight several key trends influencing both economies. In the US, the Non-Farm Payrolls for March 2024 showed a significant jump, adding 303,000 jobs, indicating robust economic activity and a strong labour market. This surge is likely to boost consumer confidence and spending, contributing to overall economic growth. Meanwhile, the Core PCE Price Index rose by 0.3% in February, suggesting that inflation pressures remain contained, a positive sign for ongoing monetary policy assessments.
On the other hand, the ISM Manufacturing PMI's rebound to 50.3 points to a stabilization in the manufacturing sector, despite earlier slowdowns. This resilience suggests that the industrial segment is adapting to prevailing economic conditions, which could support sustained economic output.
In Canada, the sharp rise in Housing Starts to 253.5K in February underlines a booming housing sector, crucial for broader economic stability through its ripple effects on jobs and consumer spending. Additionally, the stable Inflation Rate at 2.8% year-over-year in February provides the Bank of Canada with a cushion to maintain a more measured approach to interest rates, which is essential for long-term economic stability.
The GDP growth of 0.6% month-over-month in January also mirrors strong economic momentum, underscoring Canada's robust economic fundamentals. Together, these indicators from both countries present a picture of ongoing recovery and resilience, with central banks having adequate leeway to navigate monetary policies amidst global economic uncertainties.
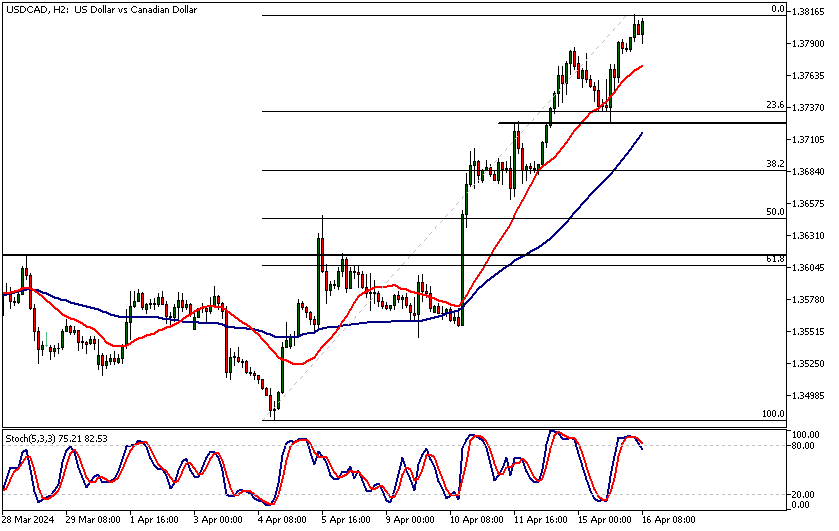
USDCAD is trending higher in the 2h chart ahead of today's CPI release. As usual, these news events could bring added volatility so it's good to map the main support and resistance levels. The nearest supporting confluence area at 1.3725 – 1.3733 could attract buyers should there be a retracement back to it. Should this happen potential buyers might be targeting the daily resistance level at 1.3855. Alternatively, if the confluence area at 1.3725 – 1.3733 is penetrated decisively, look for a move down to 1.3680. Note that above 1.3855, the upside could become limited as the market is then trading relatively close to the weekly high at 1.3900.
USOIL
Last week, the upward momentum in oil prices halted, influenced by expectations of fewer Federal Reserve rate cuts which bolstered the dollar and weighed on oil prices. This was compounded by the International Energy Agency's (IEA) downward revision of its 2024 oil demand growth forecast by 130,000 barrels per day to 1.2 million bpd, attributing this adjustment to reduced consumption in OECD countries and a continued slump in factory activity. Despite the lifting of COVID-19 restrictions in China, the expected surge in demand was short-lived, exacerbated by unusually warm weather that decreased the need for heating fuel significantly.
The IEA's projection starkly contrasts with OPEC's more optimistic forecast, which predicts a demand growth of 2.25 million bpd, driven by increased fuel consumption during the summer. Additionally, the IEA anticipates a slight decline in demand growth for 2025, influenced by steady global GDP growth and rapid adoption of electric vehicles. It's noteworthy that China's share of global demand growth is predicted to decrease substantially.
Compounding the market dynamics, oil prices dropped on Monday following a massive attack by Iran on Israel. The assault, Iran's first on Israeli soil in over three decades, involved over 300 missiles and drones but resulted in minimal damage, largely due to Israel's effective Iron Dome system.
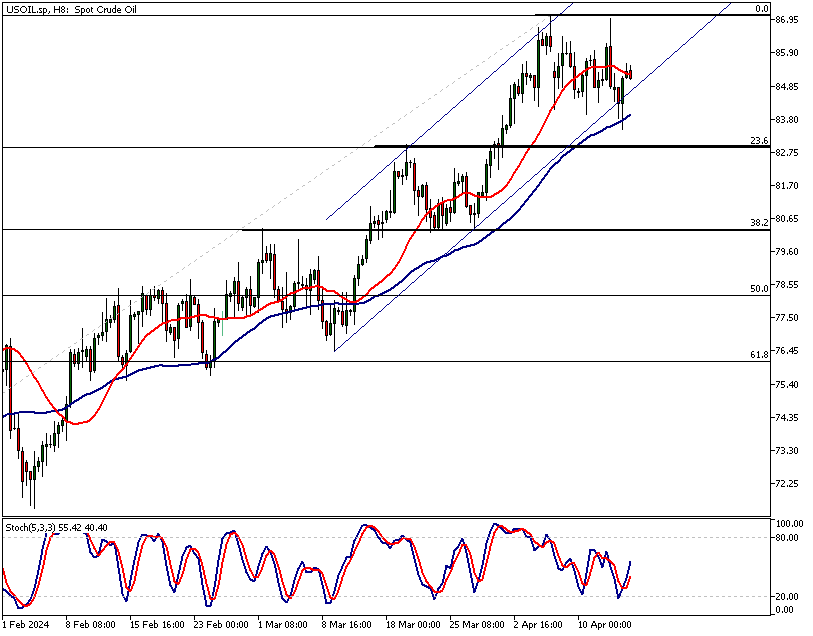
USOIL has been trending higher but the double top created last week in the 8h chart indicates demand isn’t anymore as strong as it was in March. The market moved sideways last week and has now somewhat successfully tested the SMA(50) so the uptrend might not be over yet. The market remains mildly bullish above 83.48. If buyers defend this level, look for a move to 86.46 and then possibly to last week’s high at 87.00. Alternatively, a move to 83 could be likely. Note that if an all-out war breaks out between Israel and Iran, we could see a strong rally in the oil markets.
How will you trade the markets this week?

Risk disclaimer: CFDs are complex instruments and come with a high risk of losing money rapidly due to leverage. You should consider whether you understand how CFDs work and whether you can afford to take the high risk of losing your money. Never deposit more than you are prepared to lose. Professional client’s losses can exceed their deposit. Please see our risk warning policy and seek independent professional advice if you do not fully understand. This information is not directed or intended for distribution to or use by residents of certain countries/jurisdictions including, but not limited to, USA & OFAC. The Company holds the right to alter the aforementioned list of countries at its own discretion.
TIOmarkets offers an exclusively execution-only service. The views expressed are for information purposes only. None of the content provided constitutes any form of investment advice. The comments are made available purely for educational and marketing purposes and do NOT constitute advice or investment recommendation (and should not be considered as such) and do not in any way constitute an invitation to acquire any financial instrument or product. TIOmarkets and its affiliates and consultants are not liable for any damages that may be caused by individual comments or statements by TIOmarkets analysis and assumes no liability with respect to the completeness and correctness of the content presented. The investor is solely responsible for the risk of his/her investment decisions. The analyses and comments presented do not include any consideration of your personal investment objectives, financial circumstances, or needs. The content has not been prepared in accordance with any legal requirements for financial analysis and must, therefore, be viewed by the reader as marketing information. TIOmarkets prohibits duplication or publication without explicit approval.

Janne Muta holds an M.Sc in finance and has over 20 years experience in analysing and trading the financial markets.
Related Posts


Trade responsibly: CFDs are complex instruments and come with a high risk of losing all your invested capital due to leverage.